At WiseGEEK, we're committed to delivering accurate, trustworthy information. Our expert-authored content is rigorously fact-checked and sourced from credible authorities. Discover how we uphold the highest standards in providing you with reliable knowledge.
What Is Equilibrium GDP?
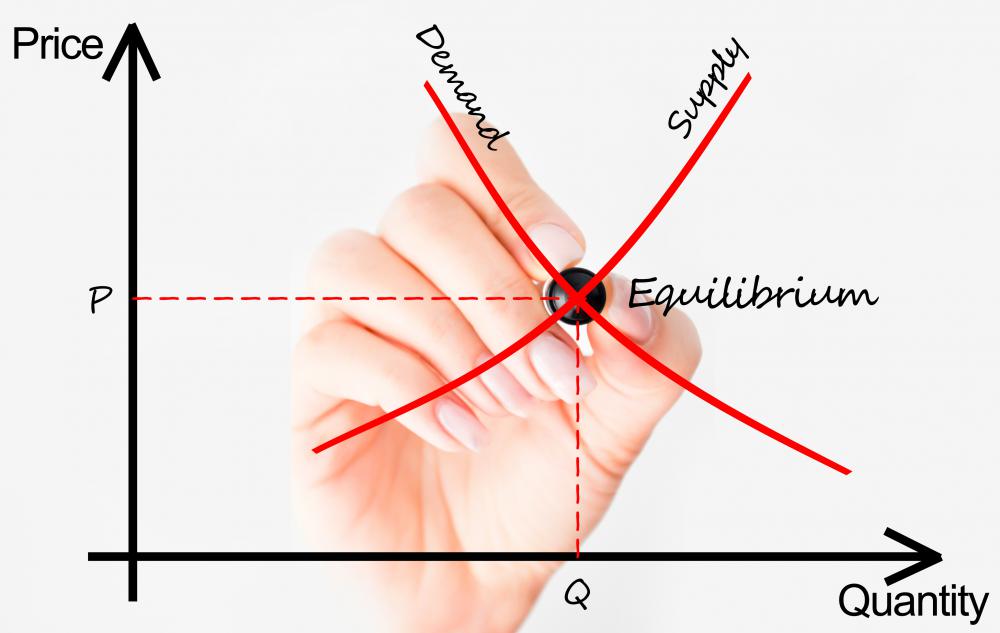
Gross domestic product (GDP) is an important economic indicator used to evaluate the financial health of a nation as a whole. It is calculated by adding together the total financial worth of all of the goods and services that were produced in a country within a year. For example, the GDP for the United States (US) is more than $14 trillion US Dollars (USD) as of 2011, though this value changes every year. Equilibrium GDP occurs when the businesses within a nation produce exactly the amount of goods and services that people want to buy. In economic terms, equilibrium GDP can be defined as the level of GDP where aggregate demand and aggregate supply are equal.
Aggregate demand represents the total amount of goods and services that people are willing and able to buy. In the US, for example, aggregate demand is equal to all the products and services produced in the US that are purchased by people domestically or internationally. Graphically, aggregate demand is shown as a downsloping curve, where demand is higher at low price points and lower at high price points.

Aggregate supply is the total value of goods and services produced in a country within a single year. If every resource within the country is put to work at its maximum level of efficiency, aggregate supply and GDP will always be equal. These resources include everything from labor to equipment and natural resources. Given that this type of efficiency is rare, aggregate supply tends to rise as price levels increase. This can be shown graphically as an upsloping line, where price and GDP increase proportionally to one another.
Graphically, equilibrium GDP can be found by locating the point where aggregate supply and demand curves intersect. Given that these values change over time, shifting the curves, equilibrium GDP is also always changing. For example, aggregate supply can increase over time, even if all resources are already being used at maximum efficiency. This occurs when technological advances allow businesses to generate more output from the same amount of input. In real-world scenarios, most economies can increase aggregate supply and equilibrium GDP by simply improving overall efficiency.
Changes in aggregate demand can also impact equilibrium GDP. When price levels increase, people can afford fewer products and services, leading to a decline in aggregate demand. This results in a decrease in equilibrium GDP. The inverse is also true, where lower prices lead to an increase in aggregate demand, as well as an increase in equilibrium GDP.
AS FEATURED ON:
AS FEATURED ON:

-
![Equilibrium GDP can be found graphically by locating the point where aggregate supply and demand curves intersect.]() By: adrian_ilie825Equilibrium GDP can be found graphically by locating the point where aggregate supply and demand curves intersect.
By: adrian_ilie825Equilibrium GDP can be found graphically by locating the point where aggregate supply and demand curves intersect.
Discuss this Article
Post your comments